Making Complex Processes Visible: A Guide to the Four Circle Elements Process Chart Slide
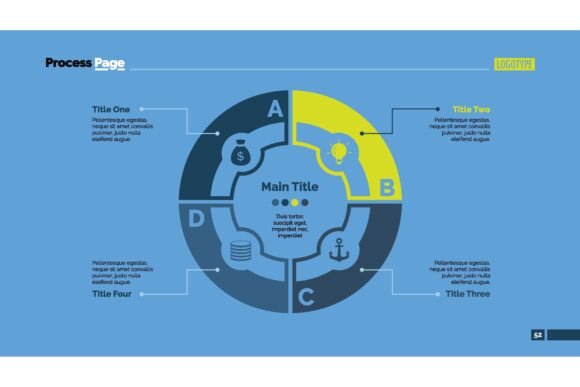
Communicating interconnected ideas often requires more than a list or a simple arrow diagram. When you need to show how separate components influence each other within a repeating or continuous flow, the visual format you choose directly impacts how an audience understands the relationship. One option that consistently appears in strategic presentations is a layout built around four equally prominent circular nodes, commonly referred to as a Four Circle Elements Process Chart Slide. This design places four distinct elements in a balanced arrangement, typically connected by lines or arrows that suggest movement, collaboration, or a cyclical sequence. Understanding when this structure helps and when other formats might be more appropriate can make your business communication far more effective.
What Sets the Four Circle Layout Apart
At first glance, the graphic feels approachable. Four circles, often arranged in a square, diamond, or linear flow pattern, each contain a headline, an icon, and a short descriptive block. The immediate advantage is psychological: the number four feels complete without overwhelming short-term memory. Compared to a chart with six, eight, or ten nodes, a four-element circle chart reduces cognitive load, letting viewers absorb each component before grasping the full picture.
The distinctiveness comes from how space and symmetry are used. Unlike a simple bulleted list, the circles are treated as equal containers. There is no built-in hierarchy; no single circle dominates by size or position unless the designer deliberately alters the layout. This makes it a preferred choice for illustrating concepts where every factor carries similar weight—think four core values, four market segments, four phases of an iterative cycle, or four pillars of a marketing strategy. The circular shape itself subtly suggests continuity, making the slide more effective for processes that loop back on themselves rather than ending at a final step.
Practical Strengths in Business Communication
The Four Circle Elements Process Chart Slide excels at turning abstract strategic thinking into something teams can discuss and refine. For instance, a project manager preparing a quarterly review might use it to map out the four interdependent drivers of customer satisfaction: product quality, support responsiveness, pricing fairness, and onboarding experience. Each circle holds a driver, and the connecting pathways show how a weakness in one area pulls down the others. This kind of visualization often prompts richer conversation than a spreadsheet because the spatial relationship makes tradeoffs visible.
Another strength lies in its adaptability to different visual styles. You can arrange the circles in a clean horizontal row to suggest a sequential process, like "Research – Plan – Execute – Measure." Alternatively, you can position them in a diamond or circular loop to emphasize feedback and ongoing iteration. The slide can incorporate soft gradients, minimalist icons, or company brand colors while maintaining readability. For infographics, the layout translates easily to both digital and print formats, making it a flexible resource across annual reports, pitch decks, and internal training materials.
From a design perspective, the chart offers a natural home for concise messaging. Because each circle typically accommodates no more than a short title and a sentence or two of supporting text, writers are forced to distill complex ideas. This constraint often results in clearer, more impactful communication than a dense paragraph on a slide. The visual division also helps audiences remember the four points more effectively than a continuous text block, a phenomenon supported by dual-coding theory where visual and verbal cues reinforce each other.
Comparing Circular Element Charts with Other Visual Formats
Choosing this layout involves comparing it against several common alternatives, each with its own situational advantages. A standard flowchart, for example, uses boxes and directional arrows to map linear or branching sequences. If your goal is to document a decision tree with yes/no paths, a flowchart does that more precisely than a four-circle design. The circle chart does not easily accommodate conditional logic or multiple branching outcomes; it assumes a more balanced, non-hierarchical relationship among parts.
Pyramid diagrams introduce top-down hierarchy. They are excellent when you need to show layers of importance, such as leadership levels, Maslow’s hierarchy, or a foundation-to-peak strategy. In contrast, the Four Circle Elements Process Chart Slide deliberately avoids ranking. If your content includes critical dependencies where one element must come first or is clearly foundational, a pyramid might communicate that nuance better. Using circles might inadvertently imply equal weight where it doesn't exist, causing confusion.
Venn diagrams are another comparison point. Overlapping circles highlight shared areas and differences between sets. While a four-circle Venn diagram does exist, it can become visually complex and hard to interpret quickly. The process chart variant steers away from overlapping geometric precision and instead focuses on connectivity through lines or a central hub. It trades set-theory rigor for cleaner readability, which is often the right tradeoff in a presentation setting where time is limited.
Tabular data or bulleted lists remain the simplest way to present multiple data points with high density. A four-circle chart sacrifices data density for clarity and aesthetic appeal. If you need to present dozens of figures, percentages, or long descriptions, a table or a series of structured slides will likely serve you better. The circle chart is not a data visualization tool in the strict sense; it is a relationship mapping and idea communication tool.
When the Four Circle Design Becomes a Limitation
No single slide layout is universally perfect. This design introduces constraints that can work against your message if not carefully evaluated. The most obvious is the fixed number of elements. Having exactly four circles means you must either force content into four buckets, omit relevant information, or awkwardly combine distinct ideas under one label. If your analysis naturally reveals three or five key themes, using this slide can distort reality. Audiences often sense when information is being crammed into an arbitrary container, and credibility suffers.
Another tradeoff involves the depth of narrative each circle can hold. While brevity is generally positive, some concepts require more explanation than a short caption allows. Presenters sometimes compensate with tiny text or oversized circles, but this undermines the design’s original clean aesthetic. When each element demands a nuanced breakdown, consider whether a series of dedicated slides—perhaps one for each component—followed by a summary visual would be more effective than a single chart trying to do too much heavy lifting.
Additionally, the symmetrical nature of the layout struggles with asymmetric relationships. If Element A strongly influences B and C but D operates largely independently, the equal visual treatment can mislead stakeholders about the true dynamics. In such cases, a diagram with weighted arrows, varied node sizes, or a network map might convey the real-world complexity more accurately. The four-circle chart works best when the relationships are genuinely balanced or when the goal is to present an idealized model rather than a messy reality.
Understanding the Best-Fit Scenarios
So when does a Four Circle Elements Process Chart Slide become the most natural tool? Think of scenarios where you want to define an overarching framework that will be revisited throughout a presentation or document. A marketing director outlining the annual strategy might use the four circles to represent the core pillars: brand awareness, lead generation, customer retention, and product advocacy. These pillars aren't sequential; they run concurrently and feed into each other. The circle chart visually reinforces that synergy without suggesting a start or endpoint.
Another ideal use case is for introducing a team or departmental structure based on competencies rather than hierarchy. A slide displaying four overlapping skill areas—strategy, creative, analytics, and technology—can quickly communicate how a cross-functional group operates. The visual equality among circles supports the idea of balanced collaboration, which may be exactly the cultural message leadership wants to send.
In educational contexts, instructors use the format to break down complex models into digestible parts. A business ethics course might present the four factors of ethical decision-making: legal requirements, organizational values, stakeholder impact, and long-term consequences. The visual helps students see these not as isolated checkboxes but as interconnected considerations that must be weighed together.
Agile teams and design thinking practitioners often reach for a four-element circular layout to illustrate iterative loops. Empathize, Define, Ideate, and Prototype can be arranged in a circular flow with arrows indicating the iterative nature rather than a rigid waterfall sequence. This aligns with the methodology’s philosophy while remaining visually tidy.
Evaluating Design Decisions for Maximum Impact
Within the broad category of four-element chart slides, subtle design choices influence how the message is received. A version with a central connecting shape—like a diamond or circle in the middle—emphasizes the unifying theme or the outcome that arises from the four factors. A decentralized layout where circles are linked only to their immediate neighbors highlights a chain or cycle. The color palette also matters: analogous colors suggest harmony, while contrasting colors can indicate tension or distinct categories. These are not merely aesthetic preferences; they shape the narrative.
Consider whether you need static circles or if an animated build reveals each element one at a time. In a live presentation, revealing the circles sequentially can help control audience focus and build a logical argument. However, for a leave-behind document or a slide shared asynchronously, a static full view often works better because the viewer scans at their own pace. The Four Circle Elements Process Chart Slide is flexible enough to support both approaches if the underlying design is clean.
Typography and icon selection further refine whether the slide feels corporate, creative, or academic. A slide using crisp sans-serif fonts and flat icons feels modern and professional, while one with serif fonts and illustrated icons might suit a more traditional or boutique brand. These decisions should align with the overall communication style of your organization or project, ensuring the chart doesn't feel like an out-of-place template.
Integrating the Chart into a Larger Story
A single slide rarely stands alone; its value multiplies when woven into a structured narrative. You might introduce the four-circle chart early in a deck as a high-level model, then dedicate a subsequent section to each circle. This creates a recognizable visual anchor that helps the audience navigate the presentation. Alternatively, you could use the chart as a summary slide at the end of each major section, reinforcing how the detailed content ties back to the core framework. The repetition of the visual motif aids retention and gives the presentation a cohesive feel.
For reports and web content, the same graphic can be reused at multiple touchpoints, serving as a consistent reference. When readers encounter the four circles in an executive summary, later in chapter headings, and again in a conclusion, they internalize the model more deeply. This multi-touchpoint strategy leverages the human brain's preference for pattern recognition and reduces the effort needed to understand new information.
Making an Informed Choice Without Overcomplication
Selecting the right visual tool does not require a design degree, but it does call for a thoughtful evaluation of your content and audience. Start by listing the key ideas you need to communicate. Count them. If the number naturally falls around four and those ideas share equal importance with mutual influence, the circle chart is a strong candidate. If there is a clear sequence with a start and end, a linear timeline or chevron diagram will often be clearer. If hierarchy is essential, explore pyramids or stacked layers. The goal is a match between the structure of your information and the visual grammar of the chart.
Testing a draft with a colleague can reveal misalignments early. Ask someone unfamiliar with the content to describe what the slide tells them. If they interpret a hierarchical meaning where none was intended, you may need to adjust the layout or reconsider the chosen format. This kind of simple feedback loop prevents costly misunderstandings later when the slide is presented to decision-makers or clients.
Ultimately, a Four Circle Elements Process Chart Slide is a purposeful simplification tool. It works best when you have carefully curated the four most important points and you trust that the audience benefits from seeing them as a connected whole. When that alignment exists, the slide can become one of the most memorable and frequently referenced parts of your communication material. When the fit isn’t there, exploring other diagramming options is the more honest and effective path. Neither choice is universally right; the skill lies in matching the tool to the message, not the other way around.
Long-Term Value and Reusability
Organizations often build libraries of reusable slide assets, and the four-circle process chart frequently earns a permanent spot. Because the structure is neutral, it can be adapted across departments—HR for competency models, finance for risk categories, operations for quality management pillars, sales for account planning cycles. Having a well-designed, brand-compliant version ready to go saves time and maintains visual consistency. Over time, internal audiences also become familiar with the model, which speeds up comprehension when they encounter it in different contexts.
Training materials and onboarding decks benefit from this familiarity. New hires who see a consistent visual language built around clear, four-part frameworks can more quickly grasp how the organization thinks about its work. However, overuse can breed complacency. If every strategic concept is forced into a four-circle mold regardless of fit, the tool loses its effectiveness. Rotate among a set of diagram types to keep your visual vocabulary fresh and accurate.
The Four Circle Elements Process Chart Slide occupies a useful middle ground between simplicity and expressiveness. It doesn't handle every communication challenge, but it handles a surprising number with grace. When you need to show how separate yet connected forces shape a situation, this visual approach offers a clarity that words alone rarely achieve. By weighing its strengths and limitations against your specific needs, you position yourself to communicate with both precision and impact, helping your audience see relationships they might otherwise miss.